|
Expansion of Hong Kong |
|
Construction Phase Quarterly EM&A Report No.9 (1 January to 31 March 2018) |
|
3RS |
Three-Runway System |
|
AAHK |
Airport Authority Hong Kong |
|
AECOM |
AECOM Asia Company Limited |
|
AFCD |
Agriculture, Fisheries and Conservation Department |
|
AIS |
Automatic Information System |
|
ANI |
Encounter Rate of Number of Dolphins |
|
APM |
Automated People Mover |
|
AW |
Airport West |
|
BHS |
Baggage Handling System |
|
CAP |
Contamination Assessment Plan |
|
CAR |
Contamination Assessment Report |
|
CNP |
Construction Noise Permit |
|
CTP |
Coral Translocation Plan |
|
CWD |
Chinese White Dolphin |
|
DCM |
Deep Cement Mixing |
|
DEZ |
Dolphin Exclusion Zone |
|
DO |
Dissolved Oxygen |
|
EAR |
Ecological Acoustic Recorder |
|
EIA |
Environmental Impact Assessment |
|
EM&A |
Environmental Monitoring & Audit |
|
EP |
Environmental Permit |
|
EPD |
Environmental Protection Department |
|
ET |
Environmental Team |
|
FCZ |
Fish Culture Zone |
|
HDD |
Horizontal Directional Drilling |
|
HKBCF |
Hong Kong-Zhuhai-Macao Bridge Hong Kong Boundary Crossing Facilities |
|
HKIA |
Hong Kong International Airport |
|
HSF |
High Speed Ferry |
|
IEC |
Independent Environmental Checker |
|
LKC |
Lung Kwu Chau |
|
MMHK |
Mott MacDonald Hong Kong Limited |
|
MMWP |
Marine Mammal Watching Plan |
|
MSS |
Marine Surveillance System |
|
MTRMP-CAV |
Marine Travel Routes and Management Plan for Construction and Associated Vessel |
|
NEL |
Northeast Lantau |
|
NWL |
Northwest Lantau |
|
PAM |
Passive Acoustic Monitoring |
|
PVD |
Prefabricated Vertical Drain |
|
SC |
Sha Chau |
|
SCLKCMP |
Sha Chau and Lung Kwu Chau Marine Park |
|
SS |
Suspended Solids |
|
STG |
Encounter Rate of Number of Dolphin Sightings |
|
SWL |
Southwest Lantau |
|
The Project |
The Expansion of Hong Kong International Airport into a Three-Runway System |
|
The SkyPier Plan |
Marine Travel Routes and Management Plan for High Speed Ferries of SkyPier |
|
TSP |
Total Suspended Particulates |
|
WL |
West Lantau |
|
WMP |
Waste Management Plan |
Executive Summary
The “Expansion of Hong Kong International Airport into a Three-Runway System” (the Project) serves to meet the future air traffic demands at Hong Kong International Airport (HKIA). On 7 November 2014, the Environmental Impact Assessment (EIA) Report (Register No.: AEIAR-185/2014) for the Project was approved and an Environmental Permit (EP) (Permit No.: EP-489/2014) was issued for the construction and operation of the Project.
Airport Authority Hong Kong (AAHK) commissioned Mott MacDonald Hong Kong Limited (MMHK) to undertake the role of Environmental Team (ET) for carrying out the Environmental Monitoring & Audit (EM&A) works during the construction phase of the Project in accordance with the Updated EM&A Manual.
This is the 9th Construction Phase Quarterly EM&A Report for the Project which summarizes the monitoring results and audit findings of the EM&A programme during the reporting period from 1 January 2018 to 31 March 2018.
Key Activities in the Reporting Period
The key activities of the Project carried out in the reporting period included reclamation works and land-side works. Reclamation works included deep cement mixing (DCM) works, laying of sand blanket, seawall construction, and prefabricated vertical drain (PVD) installation. Land-side works included horizontal directional drilling (HDD) works, site establishment, site office construction, road and drainage works, cable ducting, demolition and modification of existing facilities, concrete removal works, piling, and excavation works.
EM&A Activities Conducted in the Reporting Period
The EM&A programme was undertaken in accordance with the Updated EM&A Manual of the Project. Summary of the monitoring activities during this reporting period is presented as below:
|
Monitoring Activities |
Number of Sessions |
|
1-hour Total Suspended Particulates (TSP) air quality monitoring |
102 |
|
Noise monitoring |
65 |
|
Water quality monitoring |
39 |
|
Vessel line-transect surveys for Chinese White Dolphin (CWD) monitoring |
6 |
|
Land-based theodolite tracking survey effort for CWD monitoring |
15 |
|
Terrestrial ecology monitoring |
3 |
Apart from the regular site inspections, audit of SkyPier High Speed Ferries (HSF), audit of the construction and associated vessels, and audit of the implementation of Marine Mammal Watching Plan (MMWP) and Dolphin Exclusion Zone (DEZ) Plan were also conducted in the reporting period. Based on the information including ET’s observations, records of Marine Surveillance System (MSS) and contractors’ site records, the environmental mitigation measures were properly implemented and the construction activities of the Project in the reporting period did not introduce adverse impacts to the sensitive receivers.
Snapshots of EM&A Activities in the Reporting Period
|
|
|
|
|
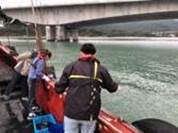
Photo 1: Land-Based Theodolite Tracking Survey for Chinese White Dolphin (CWD) at Sha Chau Conducted by ET |
Photo 2: Sample Collection for Water Quality Monitoring Conducted by ET |
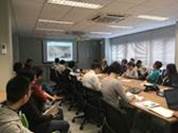
Photo 3: Environmental Management Meeting for EM&A Review with Works Contracts |

Summary Findings of the EM&A Programme
Monitoring results of construction noise, construction waste, and CWD did not trigger the corresponding Action and Limit Levels in the reporting period.
One monitoring result of 1-hour TSP triggered the Action Level in the reporting period, and the corresponding investigation was conducted accordingly. The investigation findings concluded that the case was not due to the Project.
The water quality monitoring results for dissolved oxygen (DO), turbidity, and total alkalinity obtained during the reporting period complied with their corresponding Action and Limit Levels stipulated in the EM&A programme. Relevant investigation and follow-up actions will be conducted according to the EM&A programme if the corresponding Action and Limit Levels are triggered. For suspended solids (SS), chromium, and nickel, some of the testing results triggered the relevant Action or Limit Levels in the reporting period, and the corresponding investigations were conducted accordingly. The investigation findings concluded that the cases were not related to the Project. To conclude, the construction activities in the reporting period did not introduce adverse impact to all water quality sensitive receivers.
The monthly terrestrial ecology monitoring on Sheung Sha Chau observed that HDD works were conducted at the daylighting location and there was no encroachment upon the egretry area nor any significant disturbance to ardeids at Sheung Sha Chau by the works.
The key findings of the EM&A programme during the reporting period is summarized as below:
|
|
Yes |
No |
Details |
Analysis / Recommendation / Remedial Actions |
|
Breach of Limit Level^ |
|
√ |
No breach of Limit Level was recorded. |
Nil |
|
Breach of Action Level^ |
|
√ |
No breach of Action Level was recorded. |
Nil |
|
Complaints Received |
√ |
A complaint on the use of disqualified non-road mobile machineries (NRMM) was received on 19 Jan 2018. |
Based on ET’s site inspections, it was observed that all Contractors have used NRMMs with appropriate labels. |
|
|
A complaint on noise from Sha Chau works was received on 5 Feb 2018. |
No observation relating to construction works and deployment of powered mechanical equipment during restricted hours was found during regular and ad-hoc site inspections. The contractor was reminded to comply with all conditions stipulated in the Environmental Permit and Construction Noise Permit. |
|||
|
Notification of any summons and status of prosecutions |
|
√ |
No notification of summons or prosecution were received. |
Nil |
|
Changes that affect the EM&A |
|
√ |
There was no change to the construction works that may affect the EM&A |
Nil |
Remarks: ^Only triggering of Action or Limit Level related to Project works is counted as Breach of Action or Limit Level.
1
Introduction
1.1
Background
On 7 November 2014, the Environmental Impact Assessment (EIA) Report (Register No.: AEIAR-185/2014) for the “Expansion of Hong Kong International Airport into a Three-Runway System” (the Project) was approved and an Environmental Permit (EP) (Permit No.: EP-489/2014) was issued for the construction and operation of the Project.
Airport Authority Hong Kong (AAHK) commissioned Mott MacDonald Hong Kong Limited (MMHK) to undertake the role of Environmental Team (ET) for carrying out the Environmental Monitoring & Audit (EM&A) works during the construction phase of the Project in accordance with the Updated EM&A Manual (the Manual) submitted under EP Condition 3.1[1]. AECOM Asia Company Limited (AECOM) was employed by AAHK as the Independent Environmental Checker (IEC) for the Project.
The Project covers the expansion of the existing airport into a three-runway system (3RS) with key project components comprising land formation of about 650 ha and all associated facilities and infrastructure including taxiways, aprons, aircraft stands, a passenger concourse, an expanded Terminal 2, all related airside and landside works and associated ancillary and supporting facilities. The existing submarine aviation fuel pipelines and submarine power cables also require diversion as part of the works.
Construction of the Project is to proceed in the general order of diversion of the submarine aviation fuel pipelines, diversion of the submarine power cables, land formation, and construction of infrastructure, followed by construction of superstructures.
The updated overall phasing programme of all construction works was presented in Appendix A of the Construction Phase Monthly EM&A Report No. 7 and the contract information was presented in Appendix A of the Construction Phase Monthly EM&A Report No. 22.
1.2
Scope of this Report
This is the 9th Construction Phase Quarterly EM&A Report for the Project which summarizes the key findings of the EM&A programme during the reporting period from 1 January 2018 to 31 March 2018.
1.3
Project Organisation
The Project’s organisation structure is provided in Appendix A. Contact details of the key personnel have been updated and provided in and Table 1.1.
Table 1.1: Contact Information of Key Personnel
|
Party |
Position |
Name |
Telephone |
|
Project Manager’s Representative (Airport Authority Hong Kong) |
Principal Manager, Environment |
Lawrence Tsui |
2183 2734 |
|
Environmental Team (ET) (Mott MacDonald Hong Kong Limited) |
Environmental Team Leader |
Terence Kong |
2828 5919 |
|
Deputy Environmental Team Leader |
Heidi Yu |
2828 5704 |
|
|
Deputy Environmental Team Leader |
Keith Chau |
2972 1721 |
|
|
Independent Environmental Checker (IEC) (AECOM Asia Company Limited) |
Independent Environmental Checker |
Jackel Law |
3922 9376
|
|
Deputy Independent Environmental Checker |
Roy Man |
3922 9376
|
|
Advanced Works: |
|
|
|
|
Party |
Position |
Name |
Telephone |
|
Contract P560(R) Aviation Fuel Pipeline Diversion Works (Langfang Huayuan Mechanical and Electrical Engineering Co., Ltd.) |
Project Manager |
Wei Shih |
2117 0566 |
|
Environmental Officer |
Lyn Liu |
5172 6543 |
|
Deep Cement Mixing (DCM) Works: |
|||
|
Party |
Position |
Name |
Telephone |
|
Contract 3201 DCM (Package 1) (Penta-Ocean-China State-Dong-Ah Joint Venture) |
Project Director |
Tsugunari Suzuki |
9178 9689 |
|
Environmental Officer |
Sandra Lo |
6329 3513 |
|
|
Contract 3202 DCM (Package 2) (Samsung-BuildKing Joint Venture) |
Project Manager |
Ilkwon Nam |
9643 3117 |
|
Environmental Officer |
Dickson Mak |
9525 8408 |
|
|
Contract 3203 DCM (Package 3) (Sambo E&C Co., Ltd.) |
Project Manager |
Eric Kan |
9014 6758 |
|
Environmental Officer |
David Hung |
9765 6151 |
|
|
Contract 3204 DCM (Package 4) (CRBC-SAMBO Joint Venture) |
Project Manager |
Kyung-Sik Yoo |
9683 8697 |
|
Environmental Officer |
Kanny Cho |
6799 8226 |
|
|
Contract 3205 DCM (Package 5) (Bachy Soletanche - Sambo Joint Venture) |
Deputy Project Director |
Min Park |
9683 0765 |
|
Environmental Officer |
Margaret Chung |
9130 3696 |
|
|
Reclamation Works: |
|
|
|
|
Party |
Position |
Name |
Telephone |
|
Contract 3206 (ZHEC-CCCC-CDC Joint Venture)
|
Project Manager |
Kim Chuan Lim |
3763 1509 |
|
Environmental Officer |
Kwai Fung Wong |
3763 1452 |
|
Airfield Works: |
|||
|
Party |
Position |
Name |
Telephone |
|
Contract 3301 North Runway Crossover Taxiway (FJT-CHEC-ZHEC Joint Venture) |
Project Manager |
Kin Hang Chung |
9412 1386 |
|
Terminal 2 Expansion Works: |
|||
|
Party |
Position |
Name |
Telephone |
|
Contract 3501 Antenna Farm and Sewage Pumping Station (Build King Construction Ltd.) |
Project Manager |
Raymond Au |
6985 8860 |
|
Environmental Officer |
Edward Tam |
9287 8270 |
|
|
Contract 3502 Terminal 2 APM Depot Modification Works (Build King Construction Ltd.) |
Project Manager |
Kivin Cheng |
9380 3635 |
|
Environmental Officer |
Chun Pong Chan |
9187 7118 |
|
|
Contract 3503 Terminal 2 Foundation and Substructure Works (Leighton – Chun Wo Joint Venture) |
Construction Manager |
Stephen O’Donoghue |
9732 6787 |
|
Environmental Officer |
Stephen Tsang |
5508 6361 |
|
|
Automated People Mover (APM) Works: |
|||
|
Party |
Position |
Name |
Telephone |
|
Contract 3602 Existing APM System Modification Works (Niigata Transys Co., Ltd.) |
Project Manager |
Kunihiro Tatecho |
9755 0351 |
|
Environmental Officer |
Arthur Wong |
9170 3394 |
|
|
Airport Support Infrastructure and Logistic Works: |
|||
|
Party |
Position |
Name |
Telephone |
|
Contract 3801 APM and BHS Tunnels on Existing Airport Island (China State Construction Engineering (Hong Kong) Ltd.) |
Project Manager |
Tony Wong |
9642 8672 |
|
Environmental Officer |
Fredrick Wong |
9842 2703 |
|
1.4
Contact information for the Project
The contact information for the Project is provided in Table 1.2. The public can contact us through the following channels if they have any queries and comments on the environmental monitoring data and project related information.
Table 1.2: Contact Information of the Project
|
Channels |
Contact Information |
|
Hotline |
3908 0354 |
|
|
|
|
Fax |
3747 6050 |
|
Postal Address |
Airport Authority Hong Kong HKIA Tower 1 Sky Plaza Road Hong Kong International Airport Lantau Hong Kong Attn: Environmental Team Leader Mr Terence Kong c/o Mr Lawrence Tsui (TRD) |
1.5
Summary of Construction Works
The key activities of the Project carried out in the reporting period included reclamation works and land-side works. Reclamation works included deep cement mixing (DCM) works, laying of sand blanket, seawall construction, and prefabricated vertical drain (PVD) installation. Land-side works included horizontal directional drilling (HDD) works, site establishment, site office construction, road and drainage works, cable ducting, demolition and modification of existing facilities, concrete removal works, piling, and excavation works.
The locations of the works areas are presented in Figure 1.1 to Figure 1.2.
1.6
Summary of EM&A Programme Requirements
The status for all environmental aspects is presented in Table 1.3. The EM&A requirements remained unchanged during the reporting period.
Table 1.3: Summary of Status for All Environmental Aspects under the Updated EM&A Manual
|
Parameters |
EM&A Requirements |
Status |
|
Air Quality |
|
|
|
Baseline Monitoring |
At least 14 consecutive days before commencement of construction work |
The baseline air quality monitoring result has been reported in Baseline Monitoring Report and submitted to EPD under EP Condition 3.4. |
|
Impact Monitoring |
At least 3 times every 6 days |
On-going |
|
Noise |
|
|
|
Baseline Monitoring |
Daily for a period of at least two weeks prior to the commencement of construction works |
The baseline noise monitoring result has been reported in Baseline Monitoring Report and submitted to EPD under EP Condition 3.4. |
|
Impact Monitoring |
Weekly |
On-going |
|
Water Quality |
|
|
|
General Baseline Water Quality Monitoring for reclamation, water jetting and field joint works |
Three days per week, at mid-flood and mid-ebb tides, for at least four weeks prior to the commencement of marine works. |
The baseline water quality monitoring result has been reported in Baseline Water Quality Monitoring Report and submitted to EPD under EP Condition 3.4. |
|
General Impact Water Quality Monitoring for reclamation, water jetting and field joint works |
Three days per week, at mid-flood and mid-ebb tides. |
On-going |
|
Initial Intensive Deep Cement Mixing (DCM) Water Quality Monitoring |
At least four weeks |
The Initial Intensive DCM Monitoring Report was submitted and approved by EPD in accordance with the Detailed Plan on DCM. |
|
Regular DCM Water Quality Monitoring |
Three times per week until completion of DCM works. |
On-going |
|
Waste Management |
|
|
|
Waste Monitoring |
At least weekly |
On-going |
|
Land Contamination |
|
|
|
Supplementary Contamination Assessment Plan (CAP) |
At least 3 months before commencement of any soil remediation works. |
The Supplementary CAP was submitted and approved by EPD pursuant to EP condition 2.20. |
|
Contamination Assessment Report (CAR) for Golf Course |
CAR to be submitted for golf course first; programme for submission of supplementary CAR at the other areas to be agreed. |
The CAR for Golf Course was submitted to EPD. |
|
Terrestrial Ecology |
|
|
|
Pre-construction Egretry Survey Plan |
Once per month in the breeding season between April and July, prior to the commencement of HDD drilling works. |
The Egretry Survey Plan was submitted and approved by EPD under EP Condition 2.14. |
|
Ecological Monitoring |
Monthly monitoring during the HDD construction works period from August to March. |
On-going |
|
Marine Ecology |
|
|
|
Pre-Construction Phase Coral Dive Survey |
Prior to marine construction works |
The Coral Translocation Plan was submitted and approved by EPD under EP Condition 2.12. |
|
Coral Translocation |
- |
The coral translocation was completed on 5 January 2017. |
|
Post-translocation Monitoring |
As per an enhanced monitoring programme based on the Coral Translocation Plan |
On-going |
|
Chinese White Dolphins (CWD) |
|
|
|
Baseline Monitoring |
6 months of baseline surveys before the commencement of land formation related construction works. Vessel line transect surveys: Two full surveys per month; Land-based theodolite tracking surveys: Two days per month at the Sha Chau station and two days per month at the Lung Kwu Chau station; and Passive Acoustic Monitoring (PAM): For the whole duration of baseline period. |
Baseline CWD results were reported in the CWD Baseline Monitoring Report and submitted to EPD in accordance with EP Condition 3.4. |
|
Impact Monitoring |
Vessel line transect surveys: Two full surveys per month; Land-based theodolite tracking surveys: One day per month at the Sha Chau station and one day per month at the Lung Kwu Chau station; and PAM: For the whole duration for land formation related construction works. |
On-going |
|
Landscape and Visual |
|
|
|
Baseline Monitoring |
One-off survey within the Project site boundary prior to commencement of any construction works |
The baseline landscape & visual monitoring result has been reported in Baseline Monitoring Report and submitted to EPD under EP Condition 3.4. |
|
Impact Monitoring |
Weekly |
On-going |
|
Environmental Auditing |
|
|
|
Regular site inspection |
Weekly |
On-going |
|
Marine Mammal Watching Plan (MMWP) implementation measures |
Monitor and check |
On-going |
|
Dolphin Exclusion Zone (DEZ) Plan implementation measures |
Monitor and check |
On-going |
|
SkyPier High Speed Ferries (HSF) implementation measures |
Monitor and check |
On-going |
|
Construction and Associated Vessels implementation measures |
Monitor and check |
On-going |
|
Complaint Hotline and Email Channel |
Construction phase |
On-going |
|
Environmental Log Book |
Construction phase |
On-going |
Taking into account the construction works in the reporting period, impact monitoring of air quality, noise, water quality, waste management, terrestrial ecology, landscape and visual, and CWD were carried out in the reporting period.
The EM&A programme also involved weekly site inspections and related auditing conducted by ET for the checking of implementation of required environmental mitigation measures recommended in the approved EIA Report. To promote the environmental awareness and enhance the environmental performance of the contractors, environmental briefings, environmental trainings, and regular environmental management meetings were conducted during the reporting period which are summarized as below:
● Three dolphin observer trainings provided by ET;
● Seven skipper trainings provided by ET;
● One environmental briefing on EP and EM&A requirements of the 3RS provided by ET;
● One environmental briefing on environmental compliance and construction waste management provided by EPD and AAHK; and
● 26 occasions of environmental management meetings on EM&A matters.
The EM&A programme has been following the recommendations presented in the approved EIA Report and the Manual. A summary of implementation status of the environmental mitigation measures for the construction phase of the Project during the reporting period is provided in Appendix B.
2
Environmental Monitoring and
Auditing
2.1
Air Quality Monitoring
Impact 1-hour Total Suspended Particulates (TSP) monitoring was conducted three times every six days at two representative monitoring stations during the reporting period. The locations of monitoring stations are described in Table 2.1 and presented in Figure 2.1.
2.1.1
Action and Limit Levels
The Action and Limit Levels of the air quality monitoring stipulated in the EM&A programme for triggering the relevant investigation and follow-up procedures under the programme are provided in Table 2.1 for reference.
Table 2.1: Impact Air Quality Monitoring Stations
|
Monitoring Station |
Location |
Action Level (mg/m3) |
Limit Level (mg/m3) |
|
AR1A |
Man Tung Road Park |
306 |
500 |
|
AR2 |
Village House at Tin Sum |
298 |
2.1.2 Summary of Monitoring Results
The air quality monitoring results in the reporting period are summarized in Table 2.2 and the graphical plot is presented in Appendix C.
Table 2.2: Percentage Compliance of Air Quality Monitoring Results
|
|
AR1A |
AR2 |
|
Jan 2018 |
100.0% |
94.4% |
|
Feb 2018 |
100.0% |
100.0% |
|
Mar 2018 |
100.0% |
100.0% |
|
Overall |
100.0% |
98.0% |
|
Note: The percentages are calculated by dividing the number of monitoring results within their corresponding Action and Limit Level by the total number of monitoring results. |
||
One monitoring result of 1-hour TSP at AR2 triggered the Action Level on 8 January 2018. Actions were taken accordingly based on the established Event and Action Plan as presented in the Manual. Details of the investigation findings are presented in Construction Phase Monthly EM&A Report No. 25, which concluded that the case was not related to the Project.
General meteorological conditions throughout the impact monitoring period were recorded and summarized in Table 2.3.
Table 2.3: General Meteorological Condition During Impact Air Quality Monitoring
|
|
Weather |
Wind Direction |
|
Jan 2018 |
Sunny to Rainy |
Northeast or East |
|
Feb 2018 |
Sunny to Cloudy |
North or East |
|
Mar 2018 |
Sunny to Fine |
South or Southwest |
2.1.3
Conclusion
No dust emission source from Project activities was observed during impact air quality monitoring. Major sources of dust observed at the monitoring stations during the monitoring sessions were local air pollution and nearby traffic emissions. It is considered that the monitoring work in the reporting period was effective and there was no adverse impact attributable to the works of the Project.
2.2
Noise Monitoring
Impact noise monitoring was conducted at five representative monitoring stations once per week during 0700 and 1900 in the reporting period. The locations of monitoring stations are described in Table 2.4 and presented in Figure 2.1.
2.2.1
Action and Limit Levels
The Action and Limit Levels of the noise monitoring stipulated in the EM&A programme for triggering the relevant investigation and follow-up procedures under the programme are provided in Table 2.4 for reference.
Table 2.4: Impact Noise Monitoring Results
|
Monitoring Station |
Location |
Action Level |
Limit Level |
|
NM1A |
Man Tung Road Park |
When one documented complaint is received from any one of the sensitive receivers |
75 dB(A) |
|
NM3A |
Site Office |
75 dB(A) |
|
|
NM4 |
Ching Chung Hau Po Woon Primary School |
65dB(A) / 70 dB(A) (i) |
|
|
NM5 |
Village House in Tin Sum |
75 dB(A) |
|
|
NM6 |
House No. 1, Sha Lo Wan |
75 dB(A) |
|
|
Note: (i) Reduced to 70dB(A) for school and 65dB(A) during school examination periods at NM4. |
|||
2.2.2
Summary of Monitoring Results
The noise monitoring results in the reporting period are summarized in Table 2.5 and the graphical plot is presented in Appendix C.
Table 2.5: Impact Noise Monitoring Results
|
|
NM1A |
NM3A |
NM4 |
NM5 |
NM6 |
|
Jan 2018 |
100.0% |
100.0% |
100.0% |
100.0% |
100.0% |
|
Feb 2018 |
100.0% |
100.0% |
100.0% |
100.0% |
100.0% |
|
Mar 2018 |
100.0% |
100.0% |
100.0% |
100.0% |
100.0% |
|
Overall |
100.0% |
100.0% |
100.0% |
100.0% |
100.0% |
|
Note: The percentages are calculated by dividing the number of monitoring results within their corresponding Action and Limit Level by the total number of monitoring results. |
|||||
The monitoring results complied with the corresponding Action and Limit Levels at all monitoring stations in the reporting period.
2.2.3
Conclusion
As the construction activities were far away from the monitoring stations, major sources of noise dominating the monitoring stations observed during the construction noise impact monitoring were road traffic at NM1A, student activities, aircraft and helicopter noise at NM4, and aircraft and helicopter noise at NM3A, NM5 and NM6. It is considered that the monitoring work in the reporting period was effective and there was no adverse impact attributable to the works of the Project.
2.3
Water Quality Monitoring
During the reporting period, water quality monitoring was conducted three days per week, at mid-flood and mid-ebb tides, at a total of 22 water quality monitoring stations, comprising 12 impact (IM) stations, 7 sensitive receiver (SR) stations, and 3 control (C) stations in the vicinity of the water quality sensitive receivers around the airport island in accordance with the Manual. The purpose of water quality monitoring at the IM stations is to promptly capture any potential water quality impacts from the Project before the impacts could become apparent at sensitive receivers (represented by the SR stations). Table 2.6 describes the details of the monitoring stations. Figure 2.2 shows the locations of the monitoring stations.
Table 2.6: Monitoring Locations and Parameters for Impact Water Quality Monitoring
|
Monitoring Stations |
Description |
Coordinates |
Parameters |
||
|
|
|
Easting |
Northing |
|
|
|
C1 |
Control Station |
804247 |
815620 |
General Parameters DO, pH, Temperature, Salinity, Turbidity, SS DCM Parameters Total Alkalinity, Heavy Metals(2) |
|
|
C2 |
Control Station |
806945 |
825682 |
||
|
C3(3) |
Control Station |
817803 |
822109 |
||
|
IM1 |
Impact Station |
806458 |
818351 |
||
|
IM2 |
Impact Station |
806193 |
818852 |
||
|
IM3 |
Impact Station |
806019 |
819411 |
||
|
IM4 |
Impact Station |
805039 |
819570 |
||
|
IM5 |
Impact Station |
804924 |
820564 |
||
|
IM6 |
Impact Station |
805828 |
821060 |
||
|
IM7 |
Impact Station |
806835 |
821349 |
||
|
IM8 |
Impact Station |
807838 |
821695 |
||
|
IM9 |
Impact Station |
808811 |
822094 |
|
|
|
IM10 |
Impact Station |
809838 |
822240 |
||
|
IM11 |
Impact Station |
810545 |
821501 |
||
|
IM12 |
Impact Station |
811519 |
821162 |
||
|
SR1(1) |
Future Hong Kong-Zhuhai-Macao Bridge Hong Kong Boundary Crossing Facilities (HKBCF) Seawater Intake for cooling |
812586 |
820069 |
General Parameters DO, pH, Temperature, Salinity, Turbidity, SS |
|
|
SR2(3) |
Planned marine park / hard corals at The Brothers / Tai Mo To |
814166 |
821463 |
General Parameters DO, pH, Temperature, Salinity, Turbidity, SS DCM Parameters Total Alkalinity, Heavy Metals(2)(4) |
|
|
SR3 |
Sha Chau and Lung Kwu Chau Marine Park / fishing and spawning grounds in North Lantau |
807571 |
822147 |
General Parameters DO, pH, Temperature, Salinity, Turbidity, SS |
|
|
SR4A |
Sha Lo Wan |
807810 |
817189 |
||
|
SR5A |
San Tau Beach SSSI |
810696 |
816593 |
||
|
SR6 |
Tai Ho Bay, Near Tai Ho Stream SSSI |
814663 |
817899 |
||
|
SR7 |
Ma Wan Fish Culture Zone (FCZ) |
823742 |
823636 |
||
|
SR8(4) |
Seawater Intake for cooling at Hong Kong International Airport (East) |
811418 (from July 2017 onwards) |
820246 |
||
(1) The seawater intakes of SR1 for the future HKBCF is not yet in operation, hence no water quality impact monitoring was conducted at this station. The future permanent location for SR1 during impact monitoring is subject to finalisation after the HKBCF seawater is commissioned.
(2) Details of selection criteria for the two heavy metals for regular DCM monitoring refer to the Detailed Plan on Deep Cement Mixing available on the dedicated 3RS website (http://env.threerunwaysystem.com/en/ep-submissions.html). DCM specific water quality monitoring parameters (total alkalinity and heavy metals) were only conducted at C1 to C3, SR2, and IM1 to IM12.
(3) According to the Baseline Water Quality Monitoring Report, C3 station is not adequately representative as a control station of impact/ SR stations during the flood tide. The control reference has been changed from C3 to SR2 from 1 September 2016 onwards.
(4) Total alkalinity and heavy metals results are collected at SR2 as a control station for regular DCM monitoring.
(5) The monitoring location for SR8 is subject to further changes due to silt curtain arrangements and the progressive relocation of this seawater intake.
2.3.1 Action and Limit Levels
The Action and Limit Levels for general water quality monitoring and regular DCM monitoring stipulated in the EM&A programme for triggering the relevant investigation and follow-up procedures under the programme are presented in Table 2.7. The control and IM stations during flood tide and ebb tide for general water quality monitoring and regular DCM monitoring are presented in Table 2.8.
Table 2.7: Action and Limit Levels for General Water Quality Monitoring and Regular DCM Monitoring
|
Parameters |
Action Level |
Limit Level |
||
|
Action and Limit Levels for general water quality monitoring and regular DCM monitoring (excluding SR1& SR8) |
||||
|
DO in mg/L (Surface, Middle & Bottom) |
Surface and Middle 4.5 mg/L |
Surface and Middle 4.1 mg/L 5 mg/L for Fish Culture Zone (SR7) only |
||
|
Bottom 3.4 mg/L |
Bottom 2.7 mg/L |
|||
|
SS in mg/L |
23 |
or 120% of upstream control station at the same tide of the same day, whichever is higher |
37 |
or 130% of upstream control station at the same tide of the same day, whichever is higher |
|
Turbidity in NTU |
22.6 |
36.1 |
||
|
Total Alkalinity in ppm |
95 |
99 |
||
|
Representative Heavy Metals for regular DCM monitoring (Chromium) |
0.2 |
0.2 |
||
|
Representative Heavy Metals for regular DCM monitoring (Nickel) |
3.2 |
|
3.6 |
|
|
Action and Limit Levels SR1 |
|
|
|
|
|
SS (mg/l) |
To be determined prior to its commissioning |
To be determined prior to its commissioning |
||
|
Action and Limit Levels SR8 |
|
|
|
|
|
SS (mg/l) |
52 |
|
60 |
|
Notes:
1. For DO measurement, Action or Limit Level is triggered when monitoring result is lower than the limits.
2. For parameters other than DO, Action or Limit Level of water quality results is triggered when monitoring results is higher than the limits.
3. Depth-averaged results are used unless specified otherwise.
4. Details of selection criteria for the two heavy metals for regular DCM monitoring refer to the Detailed Plan on Deep Cement Mixing available on the dedicated 3RS website http://env.threerunwaysystem.com/en/ep-submissions.html)
5. The Action and Limit Levels for the two representative heavy metals chosen will be the same as that for the intensive DCM monitoring.
Table 2.8: The Control and Impact Stations during Flood Tide and Ebb Tide for General Water Quality Monitoring and Regular DCM Monitoring
|
Control Station |
Impact Stations |
|
Flood Tide |
|
|
C1 |
IM1, IM2, IM3, IM4, IM5, IM6, IM7, IM8, SR3 |
|
SR21 |
IM7, IM8, IM9, IM10, IM11, IM12, SR1A, SR3, SR4A, SR5A, SR6, SR8 |
|
Ebb Tide |
|
|
C1 |
SR4A, SR5A, SR6 |
|
C2 |
IM1, IM2, IM3, IM4, IM5, IM6, IM7, IM8, IM9, IM10, IM11, IM12, SR1A, SR2, SR3, SR7, SR8 |
Note:
1. As per findings of Baseline Water Quality Monitoring Report, the control reference has been changed from C3 to SR2 from 1 Sep 2016 onwards.
2.3.2
Summary of Monitoring Results
The summary or results complying with their corresponding Action and Limit Levels in the reporting period are presented in Table 2.9.
Table 2.9: Percentage of Monitoring Results Complying with Action and Limit Levels
|
|
General Water Quality Monitoring |
Regular DCM Monitoring |
|||||
|
DO (Surface and Middle) |
DO (Bottom) |
SS |
Turbidity |
Alkalinity |
Chromium |
Nickel |
|
|
Jan 2018 |
100.0% |
100.0% |
99.8% |
100.0% |
100.0% |
100.0% |
100.0% |
|
Feb 2018 |
100.0% |
100.0% |
98.4% |
100.0% |
100.0% |
99.0% |
99.7% |
|
Mar 2018 |
100.0% |
100.0% |
97.3% |
100.0% |
100.0% |
100.0% |
99.7% |
|
Overall |
100.0% |
100.0% |
98.5% |
100.0% |
100.0% |
99.7% |
99.8% |
|
Note: The percentages are calculated by dividing the number of depth-averaged results complying with their corresponding Action and Limit Level by the total number of depth-averaged results. |
|||||||
The monitoring results for DO, turbidity, and total alkalinity obtained in the reporting period complied with their corresponding Action and Limit Levels stipulated in the EM&A programme. Relevant investigation and follow-up actions will be conducted according to the EM&A programme if the corresponding Action and Limit Levels are triggered. For SS, chromium, and nickel, some of the testing results triggered the relevant Action or Limit Levels in the reporting period, and the corresponding investigations were conducted accordingly.
Summaries of results triggering Action or Limit Level for SS, chromium, and nickel are presented in Table 2.8 to Table 2.14. Details of the investigation findings are presented in Construction Phase Monthly EM&A Report No. 25, 26, and 27, which concluded that all results triggering the Action or Limit Level were not related to the Project.
Table 2.10: Summary of SS Results Triggering Action or Limit Level (Mid-Ebb Tide)
|
IM1 |
IM2 |
IM3 |
IM4 |
IM5 |
IM6 |
IM7 |
IM8 |
IM9 |
IM10 |
IM11 |
IM12 |
SR2 |
SR3 |
SR4A |
SR5A |
SR6 |
SR7 |
SR8 |
|
|
04/01/2018 |
|
|
|
|
|
|
|
|
|
|
D |
|
|
|
|
|
|
|
|
|
01/02/2018 |
|
|
|
D |
|
|
|
|
|
|
|
|
|
|
|
|
|
|
|
|
03/02/2018 |
|
|
D |
|
|
|
|
|
|
|
|
|
|
|
|
|
|
|
|
|
17/03/2018 |
|
|
|
|
|
|
|
|
|
|
|
|
|
|
|
|
|
|
|
|
20/03/2018 |
|
|
|
|
|
|
|
|
|
|
|
|
|
|
|
|
|
|
|
|
No. of result triggering Action or Limit Level |
0 |
0 |
1 |
1 |
1 |
2 |
1 |
0 |
0 |
0 |
1 |
0 |
0 |
0 |
0 |
0 |
0 |
0 |
0 |
Table 2.11: Summary of SS Results Triggering Action or Limit Level (Mid-Flood Tide)
|
IM1 |
IM2 |
IM3 |
IM4 |
IM5 |
IM6 |
IM7 |
IM8 |
IM9 |
IM10 |
IM11 |
IM12 |
SR3 |
SR4A |
SR5A |
SR6 |
SR7 |
SR8 |
|
|
01/02/2018 |
|
|
|
|
D |
|
|
|
|
|
|
|
|
|
|
|
|
|
|
03/02/2018 |
|
|
|
|
|
|
|
|
|
|
|
|
|
|
|
|
|
|
|
06/02/2018 |
|
|
|
|
|
|
|
|
|
|
|
|
D |
|
|
|
|
|
|
03/03/2018 |
|
|
|
|
D |
D |
D |
|
|
|
|
|
|
|
|
|
|
|
|
06/03/2018 |
|
|
|
|
|
|
|
|
|
|
|
|
|
|
|
|
|
|
|
20/03/2018 |
|
|
|
|
D |
D |
D |
D |
D |
|
|
|
|
|
|
|
|
|
|
No. of result triggering Action or Limit Level |
0 |
0 |
2 |
2 |
3 |
2 |
2 |
1 |
1 |
0 |
1 |
0 |
1 |
0 |
0 |
0 |
0 |
0 |
Table 2.12: Summary of Chromium Results Triggering Action or Limit Level (Mid-Ebb Tide)
|
IM1 |
IM2 |
IM3 |
IM4 |
IM5 |
IM6 |
IM7 |
IM8 |
IM9 |
IM10 |
IM11 |
IM12 |
|
|
06/02/2018 |
|
|
|
|
|
|
|
|
|
|
D |
|
|
No. of result triggering Action or Limit Level |
0 |
0 |
0 |
0 |
0 |
0 |
0 |
0 |
0 |
0 |
1 |
0 |
Table 2.13: Summary of Chromium Results Triggering Action or Limit Level (Mid-Flood Tide)
|
IM1 |
IM2 |
IM3 |
IM4 |
IM5 |
IM6 |
IM7 |
IM8 |
IM9 |
IM10 |
IM11 |
IM12 |
|
|
06/02/2018 |
|
|
|
|
|
|
|
D |
D |
|
|
|
|
No. of result triggering Action or Limit Level |
0 |
0 |
0 |
0 |
0 |
0 |
0 |
1 |
1 |
0 |
0 |
0 |
Table 2.14: Summary of Nickel Results Triggering Action or Limit Level (Mid-Flood Tide)
|
IM1 |
IM2 |
IM3 |
IM4 |
IM5 |
IM6 |
IM7 |
IM8 |
IM9 |
IM10 |
IM11 |
IM12 |
|
|
20/02/2018 |
|
|
|
|
|
|
|
|
D |
|
|
|
|
29/03/2018 |
|
|
|
|
|
|
|
|
D |
|
|
|
|
No. of result triggering Action or Limit Level |
0 |
0 |
0 |
0 |
0 |
0 |
0 |
0 |
2 |
0 |
0 |
0 |
Note: The monitoring results on monitoring dates not presented in the above tables did not trigger their corresponding Action or Limit Levels. Detailed results are presented in Appendix C.
|
Legend: |
|
|
|
Result complied with corresponding Action and Limit Levels |
|
|
Result triggered the Action Level at monitoring station located upstream of the Project based on dominant tidal flow |
|
D |
Result triggered the Action Level at monitoring station located downstream of the Project based on dominant tidal flow |
|
D |
Result triggered the Limit Level at monitoring station located downstream of the Project based on dominant tidal flow |
|
|
Upstream station with respect to the Project during the respective tide based on dominant tidal flow |
|
|
Downstream station with respect to the Project during the respective tide based on dominant tidal flow |
2.3.3
Conclusion
In the reporting period, it is noted that most monitoring results complied with their corresponding Action and Limit Levels, while minor number of results triggered their corresponding Action or Limit Level, and investigations were conducted accordingly. Based on the findings presented in Construction Phase Monthly EM&A Report No. 25, 26, and 27, all results that triggered the corresponding Action or Limit Level were not related to the Project; hence, the Project did not introduce adverse impact to all water quality sensitive receivers. All required actions under the Event and Action Plan had been followed.
Nevertheless, the non-project related triggers have been attended to and have initiated corresponding action and measures. As part of the EM&A programme, the construction methods and mitigation measures for water quality will continue to be monitored and opportunities for further enhancement will continue to be explored and implemented where possible, to strive for better protection of water quality and the marine environment.
In the meantime, the contractors were reminded to implement and maintain all mitigation measures during weekly site inspection. These include maintaining the silt curtain for sand blanket laying properly and maintaining the levels of materials on barges to avoid overflow as recommended in the Manual.
2.4 Waste Monitoring
In accordance with the Manual, the waste generated from construction activities was audited once per week to determine if wastes were being managed in accordance with the Waste Management Plan (WMP) prepared for the Project, contract-specific WMP, and any statutory and contractual requirements. All aspects of waste management including waste generation, storage, transportation, and disposal were assessed during the audits.
2.4.1
Action and Limit Levels
The Action and Limit Levels of the construction waste are provided in Table 2.15.
Table 2.15: Action and Limit Levels for Construction Waste
|
Monitoring Stations |
Action Level |
Limit Level |
|
Construction Area |
When one valid documented complaint is received |
Non-compliance of the WMP, contract-specific WMPs, any statutory and contractual requirements |
2.4.2
Summary of Monitoring Results
Based on updated contractors’ information, summary of construction waste generated in the reporting period is presented in Table 2.16.
The monitoring results complied with the corresponding Action and Limit Levels in the reporting period.
Table 2.16: Summary of Construction Waste Generated in the Reporting Period
|
|
Excavated Material (m3)1 |
C&D2 Material Reused in the Project (m3) |
C&D Material Disposed of as Public Fill (m3) |
Chemical Waste (kg) |
Chemical Waste (L) |
General Refuse (tonne)3 |
|
Jan 2018 |
662 |
4,310 |
597 |
210 |
45,200 |
162 |
|
Feb 2018 |
739 |
480 |
1,387 |
225 |
25,000 |
141 |
|
Mar 2018 |
1,236 |
563 |
1,689 |
165 |
8,000 |
258 |
|
Total |
2,637 |
5,353 |
3,673 |
600 |
78,200 |
561 |
|
Notes: 1. The excavated materials were temporarily stored at stockpiling area and will be reused in the Project. 2. C&D refers to Construction and Demolition. 3. Figures are rounded off to the nearest tonne. 4. Paper, plastics, and metals were recycled in the reporting period. |
||||||
Recommendations were provided during monitoring, including provision and maintenance of spill kits and drip trays, provision of proper storage area for general refuse and chemical waste, as well as regular segregation and removal of waste. The contractors had taken actions to implement the recommended measures.
2.5 Chinese
White Dolphin Monitoring
CWD monitoring was conducted by vessel line transect survey at a frequency of two full surveys per month, supplemented by land-based theodolite tracking survey and PAM. The frequency of the land-based theodolite tracking survey during the construction phase was one day per month at both Sha Chau (SC) and Lung Kwu Chau (LKC) stations as stipulated in the Manual. Additional land-based theodolite tracking survey at the SC station and the LKC station (in total 2 tracking days and 3 tracking days per month at respective stations) were also conducted on a voluntary basis to collect supplementary information for the Project. Monitoring was fully completed in the reporting period. The vessel survey transect lines matched those proposed in the Manual and transect lines are consistent with those used in the Agriculture, Fisheries and Conservation Department (AFCD) long-term CWD monitoring programme. The transect locations of CWD monitoring by vessel line transect survey conducted from October to December 2017 are shown in Figure 2.3, whilst the land-based theodolite tracking survey stations are described in Table 2.17 and depicted in Figure 2.4. The location of the PAM device is shown in Figure 2.10.
Table 2.17: Land-based Theodolite Tracking Survey Station Details
|
Stations |
Location |
Geographical Coordinates |
Station Height (m) |
Approximate Tracking Distance (km) |
|
D |
Sha Chau (SC) |
22° 20’ 43.5” N 113° 53’ 24.66” E |
45.66 |
2 |
|
E |
Lung Kwu Chau (LKC) |
22° 22’ 44.83” N 113° 53’ 0.2” E |
70.40 |
3 |
2.5.1
Action and Limit Levels
The Action Level and Limit Level for CWD monitoring were formulated by an action response approach using the running quarterly dolphin encounter rates (STG and ANI) derived from baseline monitoring data, as presented in the CWD Baseline Monitoring Report. The derived values of Action and Limit Levels for CWD monitoring are shown in Table 2.18.
Table 2.18: Derived Values of Action Level and Limit Level for Chinese White Dolphin Monitoring
|
|
NEL, NWL, AW, WL and SWL as a Whole |
|
Action Level |
Running quarterly STG < 1.86 & ANI < 9.35 |
|
Limit Level |
Two consecutive running quarterly (3-month) STG < 1.86 & ANI < 9.35 |
2.5.2
Summary
of Monitoring Results
2.5.2.1
Vessel Line Transect Survey
Survey Effort
During the reporting period, six complete sets of vessel line transect surveys were conducted from January to March 2018 to cover all transects in Northeast Lantau (NEL), Northwest Lantau (NWL), Airport West (AW), West Lantau (WL) and Southwest Lantau (SWL) survey areas twice per month.
A total of around 1,368 km of survey effort was collected from these surveys, with around 91.8% of the total survey effort being conducted under favourable weather condition (i.e. Beaufort Sea State 3 or below with favourable visibility). Details of the survey effort data are presented in Appendix C.
CWD Sighting
From January to March 2018, there were in total 65 sightings of CWDs with 203 dolphins sighted (Table 2.19). Amongst the sightings of CWDs, 60 sightings with 195 dolphins were made during on-effort searches during favourable weather conditions.
When breaking down the sightings by survey areas, 23 sightings with 63 dolphins, six sightings with 22 dolphins, 28 sightings with 99 dolphins and 8 sightings with 19 dolphins were recorded in NWL, AW, WL and SWL survey areas respectively during the current reporting period. No CWD was sighted in NEL survey area.
Compared with last quarter (i.e. October to December 2017), there is an observable increase in terms of number of CWD sightings in NWL (increased by around 77%) although the number of dolphins remains similar. In AW transects, there are significant increases in terms of both number of sighting and number of dolphins when compared with last reporting quarter (i.e. 200% and 120% increases respectively). The number of sightings and the number of dolphins in WL increased slightly by 17% and 27% respectively compared with last reporting quarter. While in SWL, the numbers remain similar.
Compared with the same quarter of last year (i.e. January to March 2017), the total number of CWD sightings and the total number of dolphins increased by around 20% and 10% respectively. Looking at the breakdown of survey areas, it is worth noting that there are significant increases in terms of both number of sightings and number of dolphins in NWL (including AW transects) by over three times. However, the combined values of WL and SWL show another picture with declines of 23% in terms of number of sightings and 28% in terms of number of dolphins.
Table 2.19 below shows the comparison of the numbers of sightings and dolphins amongst the current reporting period, last quarter, and the same quarter of year 2017.
Table 2.19: Summary of Number of CWD Sightings and Number of Dolphins for the Same Quarter Last Year, Previous Quarter, and Current Reporting Period
|
|
January to March 2017 |
October to December 2017 |
January to March 2018 |
|
NEL |
0 (0) |
0 (0) |
0 (0) |
|
NWL |
5 (16) |
13 (62) |
23 (63) |
|
AW |
2 (5) |
2 (10) |
6 (22) |
|
WL |
33 (126) |
24 (78) |
28 (99) |
|
SWL |
14 (38) |
8 (18) |
8 (19) |
|
Total |
54 (185) |
47 (168) |
65 (203) |
Note: Values in ( ) represent number of dolphins
Distribution of CWD sightings recorded from January to March 2018 are illustrated in Figure 2.5. In NWL, CWD sightings were mostly within and around Sha Chau and Lung Kwu Chau Marine Park (SCLKCMP) as well as the southwestern part of the survey area with several sightings recorded in close vicinity to the 3RS works area. It is worth noting that one off-effort sighting of CWD with two individuals was recorded feeding just outside the eastern tip of the 3RS works area in February 2018, which is the first time that CWD was encountered at that part of the NWL survey area since the start of CWD monitoring for the 3RS Project dated back to December 2015. In WL, CWD sightings were recorded on all transects generally except the short transect which passes through Hong Kong-Zhuhai-Macao Bridge Hong Kong Link Road. The majority of the CWD sightings in WL were located at the waters near Tai O and the waters between Peaked Hill and Fan Lau. While in SWL, CWD sightings scattered throughout the survey area with three sightings recorded around Soko Islands. Details of the sighting data are presented in Appendix C.
Figure 2.5: Sightings Distribution of Chinese White Dolphins
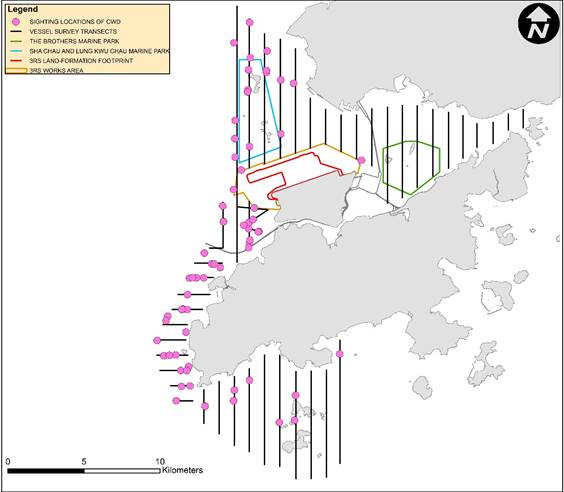
Remarks: Please note that there are 65 pink circles on the map
indicating the sighting locations of CWD. Some of them were very close to each
other and therefore appear overlapped on this sighting distribution map.
Encounter Rate
The dolphin encounter rates for the number of on-effort dolphin sightings per 100 km survey effort (STG) and for the total on-effort number of dolphins per 100 km survey effort (ANI) in the whole survey area (i.e. NEL, NWL, AW, WL and SWL) for January, February and March 2018 are summarized in Table 2.20.
In this reporting period, the monthly STG increased slightly from January to February 2018 followed by a relatively observable decline in March 2018, while the monthly ANI decreased from January 2018 to March 2018 quite significantly. Comparing with the previous reporting period, both the running quarterly STG and ANI increased slightly from 4.05 to 4.78 and from 14.75 to 15.52 respectively.
Table 2.20: Summary of Monthly and Running Quarterly STG and ANI of Chinese White Dolphin for Previous and Current Reporting Periods
|
|
Previous Reporting Period |
Current Reporting Period |
||||
|
|
Oct 17 |
Nov 17 |
Dec 17 |
Jan 18 |
Feb 18 |
Mar 18 |
|
Monthly STG |
4.54 |
2.07 |
5.33 |
5.10 |
5.38 |
3.84 |
|
Monthly ANI |
16.02 |
6.82 |
20.77 |
19.94 |
16.15 |
10.33 |
|
Running Quarterly STG |
5.90 |
4.09 |
4.05 |
4.27 |
5.27 |
4.78 |
|
Running Quarterly ANI |
19.05 |
13.91 |
14.75 |
16.27 |
18.89 |
15.52 |
Note: For detailed calculations of encounter rates STG and ANI, please refer to the Construction Phase Monthly EM&A Report No. 25, 26 and 27.
Group Size
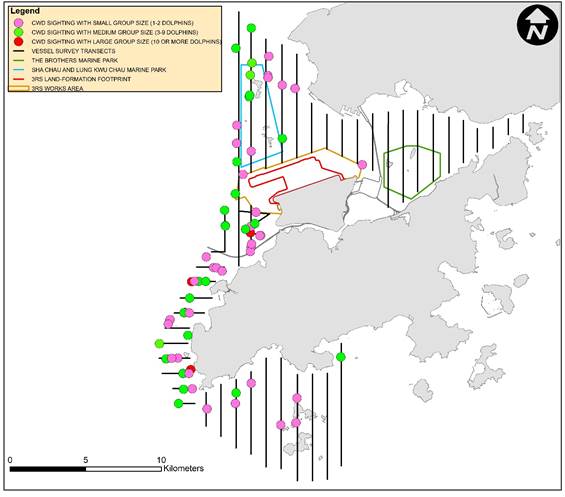
Between January and March 2018, the group size of CWD sightings ranged from 1 to 13 dolphins. The average group size of CWDs was 3.1 dolphins per group while that of the last quarter was 3.6. Small-sized CWD sightings (1-2 dolphins) were dominant, with 37 out of 65 sightings. There were three CWD sightings with large group size (10 or more dolphins) recorded in this reporting period. One of these sightings was recorded on AW transect while others were recorded in WL survey area.
In NWL and SWL, CWD sightings with small group
size were dominated in this reporting period. While in WL, the number of sightings
with small group size and the number of sightings with medium group size (3-9
dolphins) were similar. Sighting locations of CWD groups with different group
sizes are depicted in Figure 2.6.
Figure 2.6: Sighting Locations of Chinese White Dolphins with Different Group Sizes
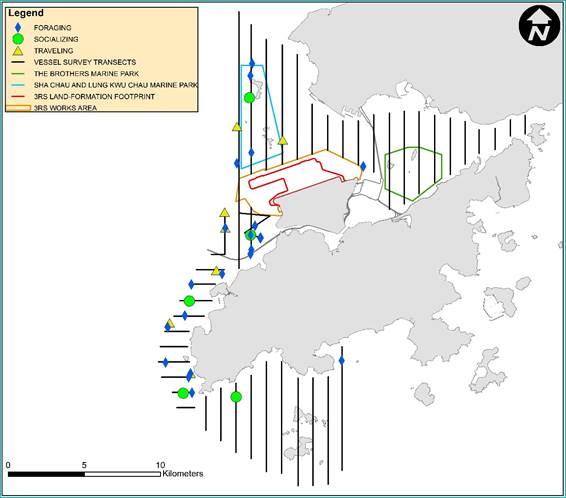
Activities and Association with Fishing Boats
During January to March 2018, 21 sightings of
CWDs were recorded with feeding activities. Amongst these 21 sightings,
six sightings were observed in association with fishing boats – four were
observed in association with operating gill netters in NWL and WL, while two
sightings were observed in association with operating purse seiners in NWL and
SWL. The numbers of sightings with feeding and association with fishing boats
are higher when compared to the last reporting period (14 sightings involved
feeding activities with three sightings observed in association with operating
fishing boats in October to December 2017). Compared with the data in the same
period of last year, CWD sightings with feeding activities increased by 40% but
the association with operating fishing boats decreased by the same percentage
(15 sightings observed with feeding activities amongst which 10 sightings were
observed with operating fishing boats in January to March 2017). The sighting
locations of CWDs engaged in different behaviours
during the reporting period are illustrated in Figure 2.7.
Figure 2.7: Sighting Locations of Chinese White Dolphins Engaged in Different Behaviours
Mother-calf Pairs
From January to March 2018, 10 sightings of CWDs were recorded with the presence of mother-and-calf, mother-and-unspotted juvenile and/or mother-and-spotted juvenile pairs. Six of these sightings were recorded in NWL (including AW) while others were sighted in WL. The sighting locations of mother-calf pairs are shown in Figure 2.8.
Figure 2.8: Sighting Locations of Mother-calf Pairs
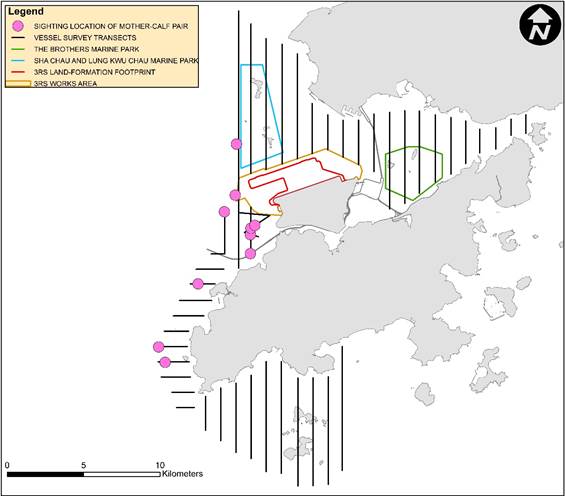
Remarks: Please note that there are 10 pink circles on the map
indicating the locations of the sightings with the presence of mother-and-calf,
mother-and-unspotted juvenile and/or mother-and-spotted juvenile pairs. Some of
them were very close to each other and therefore appear overlapped on this
sighting distribution map.
Photo Identification
During January to March 2018, a total number of 83 different CWD individuals were identified altogether for 123 times. Re-sighting information of CWD individuals provides an initial idea of their range use and apparent connection between different areas around Lantau. Amongst these 83 different CWD individuals, 30 animals (i.e. NLMM002, NLMM004, NLMM009, NLMM023, NLMM043, NLMM061, NLMM063, NLMM065, SLMM003, SLMM010, SLMM014, SLMM028, SLMM030, SLMM034, SLMM049, WLMM001, WLMM004, WLMM006, WLMM007, WLMM009, WLMM026, WLMM027, WLMM029, WLMM057, WLMM065, WLMM066, WLMM071, WLMM079, WLMM109 and WLMM111) were sighted for more than once.
Seven individuals including SLMM010, SLMM014, WLMM004, WLMM006, WLMM009, WLMM029 and WLMM057 were re-sighted in different survey areas within this reporting period. Amongst these seven animals, WLMM004, WLMM006, WLMM009, WLMM029 and WLMM057 had cross-area movement between NWL (including AW) and WL survey areas. Whilst SLMM010 and SLMM014 had cross-area movement between WL and SWL. The most frequently re-sighted individual was WLMM027 which has been re-sighted 4 times in NWL (including AW) during this reporting period. The number of CWD individuals re-sighted for more than once and the number of CWD individuals showed cross-area movement are both higher than the last reporting quarter (i.e. October to December 2017).
A summary of photo identification works is presented in Table 2.21. Representative photos of the 83 identified individuals and figures depicting the sighting locations of the aforementioned 30 re-sighted individuals recorded in this reporting period are presented Appendix C.
Table 2.21: Summary of Photo Identification
|
Individual ID |
Date of sighting |
Sighting Group No. |
Area |
|
Individual |
Date of sighting |
Sighting Group No. |
Area |
|
NLMM001 |
12-Feb-18 |
4 |
NWL |
|
SLMM055 |
14-Feb-18 |
4 |
WL |
|
NLMM002 |
18-Jan-18 |
1 |
NWL |
|
SLMM060 |
08-Jan-18 |
1 |
SWL |
|
|
12-Feb-18 |
2 |
NWL |
|
SLMM062 |
13-Feb-18 |
7 |
WL |
|
|
22-Mar-18 |
1 |
NWL |
|
WLMM001 |
13-Feb-18 |
5 |
WL |
|
NLMM004 |
06-Feb-18 |
4 |
NWL |
|
|
12-Mar-18 |
2 |
WL |
|
|
12-Feb-18 |
2 |
NWL |
|
WLMM003 |
13-Mar-18 |
3 |
WL |
|
|
22-Mar-18 |
1 |
NWL |
|
WLMM004 |
15-Jan-18 |
3 |
WL |
|
NLMM009 |
12-Feb-18 |
2 |
NWL |
|
|
13-Feb-18 |
1 |
AW |
|
|
22-Mar-18 |
1 |
NWL |
|
WLMM006 |
14-Feb-18 |
2 |
AW |
|
NLMM010 |
18-Jan-18 |
1 |
NWL |
|
|
|
3 |
WL |
|
NLMM016 |
14-Feb-18 |
5 |
WL |
|
WLMM007 |
15-Jan-18 |
8 |
WL |
|
NLMM018 |
22-Mar-18 |
1 |
NWL |
|
|
12-Mar-18 |
1 |
WL |
|
NLMM021 |
18-Jan-18 |
2 |
NWL |
|
WLMM009 |
14-Feb-18 |
2 |
AW |
|
NLMM023 |
18-Jan-18 |
1 |
NWL |
|
|
|
3 |
WL |
|
|
12-Feb-18 |
2 |
NWL |
|
WLMM015 |
15-Jan-18 |
3 |
WL |
|
NLMM037 |
18-Jan-18 |
1 |
NWL |
|
WLMM017 |
13-Feb-18 |
8 |
WL |
|
NLMM043 |
12-Feb-18 |
2 |
NWL |
|
WLMM018 |
12-Mar-18 |
1 |
WL |
|
|
22-Mar-18 |
1 |
NWL |
|
WLMM021 |
16-Jan-18 |
3 |
SWL |
|
NLMM049 |
12-Feb-18 |
3 |
NWL |
|
WLMM026 |
15-Jan-18 |
1 |
AW |
|
NLMM052 |
06-Feb-18 |
3 |
NWL |
|
|
14-Mar-18 |
1 |
NWL |
|
NLMM055 |
12-Feb-18 |
2 |
NWL |
|
|
|
3 |
NWL |
|
NLMM057 |
18-Jan-18 |
3 |
NWL |
|
WLMM027 |
15-Jan-18 |
1 |
AW |
|
NLMM061 |
15-Jan-18 |
1 |
AW |
|
|
18-Jan-18 |
4 |
NWL |
|
|
18-Jan-18 |
3 |
NWL |
|
|
14-Mar-18 |
1 |
NWL |
|
|
12-Feb-18 |
1 |
NWL |
|
|
|
3 |
NWL |
|
NLMM062 |
15-Jan-18 |
2 |
WL |
|
WLMM028 |
13-Mar-18 |
3 |
WL |
|
NLMM063 |
18-Jan-18 |
2 |
NWL |
|
WLMM029 |
14-Feb-18 |
2 |
AW |
|
|
22-Mar-18 |
1 |
NWL |
|
|
13-Mar-18 |
3 |
WL |
|
NLMM064 |
06-Feb-18 |
1 |
NWL |
|
WLMM043 |
15-Jan-18 |
3 |
WL |
|
NLMM065 |
12-Feb-18 |
4 |
NWL |
|
WLMM046 |
14-Mar-18 |
4 |
NWL |
|
|
14-Mar-18 |
4 |
NWL |
|
WLMM055 |
13-Feb-18 |
2 |
AW |
|
|
|
6 |
NWL |
|
WLMM057 |
14-Feb-18 |
2 |
AW |
|
SLMM002 |
14-Feb-18 |
8 |
WL |
|
|
|
3 |
WL |
|
SLMM003 |
15-Jan-18 |
8 |
WL |
|
WLMM060 |
18-Jan-18 |
5 |
NWL |
|
|
14-Feb-18 |
8 |
WL |
|
WLMM062 |
12-Feb-18 |
1 |
NWL |
|
|
12-Mar-18 |
1 |
WL |
|
WLMM063 |
13-Feb-18 |
1 |
AW |
|
SLMM007 |
15-Jan-18 |
8 |
WL |
|
WLMM064 |
15-Jan-18 |
2 |
WL |
|
SLMM010 |
15-Jan-18 |
8 |
WL |
|
WLMM065 |
18-Jan-18 |
3 |
NWL |
|
|
17-Jan-18 |
7 |
SWL |
|
|
14-Mar-18 |
2 |
NWL |
|
SLMM012 |
17-Jan-18 |
7 |
SWL |
|
WLMM066 |
15-Jan-18 |
1 |
AW |
|
SLMM014 |
12-Mar-18 |
1 |
WL |
|
|
18-Jan-18 |
3 |
NWL |
|
|
|
3 |
SWL |
|
|
14-Mar-18 |
2 |
NWL |
|
SLMM018 |
17-Jan-18 |
5 |
SWL |
|
WLMM071 |
15-Jan-18 |
1 |
AW |
|
SLMM022 |
15-Jan-18 |
8 |
WL |
|
|
18-Jan-18 |
5 |
NWL |
|
SLMM023 |
13-Mar-18 |
3 |
WL |
|
WLMM073 |
12-Mar-18 |
1 |
WL |
|
SLMM025 |
12-Mar-18 |
1 |
WL |
|
WLMM078 |
13-Mar-18 |
1 |
WL |
|
SLMM027 |
12-Mar-18 |
1 |
WL |
|
WLMM079 |
15-Jan-18 |
8 |
WL |
|
SLMM028 |
15-Jan-18 |
1 |
AW |
|
|
12-Mar-18 |
1 |
WL |
|
|
16-Jan-18 |
1 |
AW |
|
WLMM080 |
14-Mar-18 |
4 |
NWL |
|
SLMM030 |
17-Jan-18 |
6 |
SWL |
|
WLMM081 |
15-Jan-18 |
3 |
WL |
|
|
|
7 |
SWL |
|
WLMM107 |
13-Feb-18 |
5 |
WL |
|
SLMM031 |
13-Mar-18 |
5 |
WL |
|
WLMM108 |
15-Jan-18 |
3 |
WL |
|
SLMM034 |
12-Mar-18 |
2 |
WL |
|
WLMM109 |
15-Jan-18 |
3 |
WL |
|
|
13-Mar-18 |
2 |
WL |
|
|
|
5 |
WL |
|
SLMM037 |
14-Feb-18 |
8 |
WL |
|
|
|
7 |
WL |
|
SLMM044 |
13-Feb-18 |
8 |
WL |
|
WLMM110 |
15-Jan-18 |
3 |
WL |
|
SLMM046 |
15-Jan-18 |
3 |
WL |
|
WLMM111 |
15-Jan-18 |
3 |
WL |
|
SLMM048 |
13-Feb-18 |
5 |
WL |
|
|
|
7 |
WL |
|
SLMM049 |
15-Jan-18 |
8 |
WL |
|
WLMM112 |
15-Jan-18 |
3 |
WL |
|
|
12-Mar-18 |
1 |
WL |
|
WLMM113 |
14-Feb-18 |
4 |
WL |
|
SLMM052 |
15-Jan-18 |
8 |
WL |
|
WLMM114 |
12-Mar-18 |
1 |
WL |
|
SLMM053 |
14-Feb-18 |
3 |
WL |
|
|
|
|
|
2.5.2.2
Land-based Theodolite Tracking Survey
Survey Effort
During January to March 2018, a total of 15 days of land-based theodolite tracking survey effort were completed, including nine days on Lung Kwu Chau and six days on Sha Chau. In total, 31 CWD groups were tracked from the Lung Kwu Chau station while no CWD groups were tracked from the Sha Chau station, with an overall 0.34 CWD groups sighted per survey effort hour.
Information on survey effort and CWD groups sighted during land-based theodolite tracking surveys are presented in Table 2.22. Details on the survey effort and CWD groups tracked are presented in Appendix C. The first sighting locations of CWD groups tracked between January and March 2018 are shown in Figure 2.9.
Table 2.22: Summary of Survey Effort and CWD Group of Land-based Theodolite Tracking Survey
|
Land-based Station |
# of Survey Sessions |
Survey Effort (hh:mm) |
# CWD Groups Sighted |
CWD Group Sighting per Survey Hour |
|
January 2018 |
||||
|
Lung Kwu Chau |
3 |
18:00 |
4 |
0.22 |
|
Sha Chau |
2 |
12:00 |
0 |
0 |
|
TOTAL |
5 |
30:00 |
4 |
0.13 |
|
February 2018 |
||||
|
Lung Kwu Chau |
3 |
18:00 |
8 |
0.44 |
|
Sha Chau |
2 |
12:00 |
0 |
0 |
|
TOTAL |
5 |
30:00 |
8 |
0.27 |
|
March 2018 |
||||
|
Lung Kwu Chau |
3 |
18:00 |
19 |
1.06 |
|
Sha Chau |
2 |
12:00 |
0 |
0 |
|
TOTAL |
5 |
30:00 |
19 |
0.63 |
|
OVERALL |
15 |
90:00 |
31 |
0.34 |
Figure 2.9: Plots of First Sightings of All CWD Groups from Land-based Stations
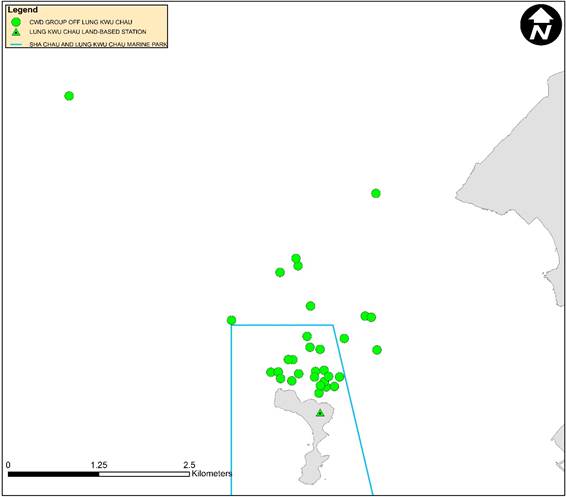
Remarks: Please note that there are 31 green circles on the map indicating the first sighting locations of CWD groups tracked off Lung Kwu Chau. Some of them were very close to each other and therefore appear overlapped on this map.
2.5.2.3
Progress Update
on PAM
An Ecological Acoustic Recorder (EAR) has been deployed and positioned to the south of Sha Chau Island inside the SCLKCMP (Figure 2.10) with 20% duty cycle with data from the EAR intended primarily to supplement the data collected from the land-based theodolite tracking survey station on Sha Chau. In this reporting period, the EAR has been retrieved on 15 January and 6 March 2018 for data collection and subsequently redeployed. The EAR deployment generally lasts around four to six weeks followed by a period of data retrieval for subsequent analysis. As the data analysis takes more than two months after retrieval, PAM results are not suitable for reporting on a quarterly basis. Rather, detailed analysis of PAM data will be presented in annual CWD reports.
2.5.2.4
Site Audit for
CWD-related Mitigation Measures
During the reporting period, silt curtains were in place by the contractors for sand blanket laying works, in which dolphin observers were deployed by each contractor in accordance with the Marine Mammal Watching Plan (MMWP). Teams of at least two dolphin observers were deployed at 17 to 24 dolphin observation stations by the contractors for continuous monitoring of the DEZ by all contractors for ground improvement works (DCM works and PVD installation) and seawall construction in accordance with the DEZ Plan. Trainings for the proposed dolphin observers on the implementation of MMWP and DEZ monitoring were provided by the ET prior to the aforementioned works, with a cumulative total of 605 individuals being trained and the training records kept by the ET. Observations were recorded on DEZ monitoring in this reporting period during site inspection by the ET and IEC. The contractors had taken actions to implement the recommended measures. From the contractors’ MMWP observation records and DEZ monitoring records, no dolphin or other marine mammals were observed within or around the silt curtains, whilst there were six records of dolphin sighting within the DEZ of DCM works in this reporting period. According to the contractor’s site records, relevant DCM works were suspended in the dolphin sighting event until the DEZ was clear of dolphin for a continuous period of 30 minutes. The contractors’ records were also audited by the ET during site inspection.
Audits of acoustic decoupling for construction vessels were carried out during weekly site inspection and summarized in Section 2.6. Summary of audits of SkyPier HSFs route diversion and speed control and construction vessel management are presented in Section 2.8 and Section 2.9 respectively.
2.6
Weekly Environmental Site Inspection
Site inspections of the construction works were carried out on a weekly basis to monitor the implementation of proper environmental pollution control and mitigation measures for the Project. Bi-weekly site inspections were also conducted by the IEC. Observations have been recorded in the site inspection checklist and passed to the contractor together with the appropriate recommended mitigation measures where necessary.
Based on the observations from site inspections, the key recommendations were related to:
● display of relevant permit, licenses, and labels;
● provision and maintenance of drip trays and chemical storage area;
● implementation of noise mitigation, dust suppression, wastewater treatment, tree protection and surface runoff prevention measures; and
● segregation of waste for recycling and disposal.
In addition, the following key recommendations were provided during site inspection on construction vessels:
● display of relevant permit, licenses, and labels;
● provision and maintenance of drip tray and chemical storage area;
● proper implementation of acoustic decoupling, wastewater treatment, dust suppression and spill and runoff preventive measures;
● proper disposal of general refuse and segregation of recyclables from general refuse; and
● ensuring the effectiveness of silt curtains.
The daily visual inspection checklists for silt curtains and bi-weekly diver inspection records which were implemented by the contractors in accordance with the Silt Curtain Deployment Plan had been checked during site inspection and reviewed at the end of the reporting period, summarizing that the silt curtains were maintained in the correct positions and intact without obvious defects or damage.
A summary of implementation status of the environmental mitigation measures for the construction phase of the Project during the reporting period is provided in Appendix C.
2.7 Ecological
Monitoring
In accordance with the Manual, ecological monitoring shall be undertaken monthly at the HDD daylighting location on Sheung Sha Chau Island during the HDD construction works period from August to March to identify and evaluate any impacts with appropriate actions taken as required to address and minimise any adverse impact found.
Monthly ecological monitoring was carried out in January, February, and March 2018 on Sheung Sha Chau Island. No encroachment of any works upon the egretry area nor any significant disturbance to the ardeids on the island by the works was recorded during ecological monitoring. Signs of early breeding activities by Black-crowned Night Heron and Little Egret were observed on trees located further east of the previously identified egretry area where it is at the southern side of Sheung Sha Chau Island. At the HDD daylighting location, neither nest nor breeding activity of ardeids were found during the monthly ecological monitoring and weekly site inspections in the reporting period. The site photos and location map regarding the ecological monitoring for HDD works and egretry area are provided in Appendix C for reference. All the HDD construction works on Sheung Sha Chau had been completed and retreated on 29 March 2018. No construction works will be conducted on Sheung Sha Chau Island during the ardeid’s breeding season.
2.8
Audit of SkyPier High Speed Ferries
In total, 2,582 ferry movements between HKIA SkyPier and Zhuhai / Macau were audited in the reporting period. The daily movements of all SkyPier HSFs in the reporting period ranged between 84 and 96, which falls within the maximum daily cap number of 125.
All HSFs travelled through the SCZ with average speed within 15 knots (10.1 knots to 14.0 knots), which complied with the Marine Travel Routes and Management Plan for High Speed Ferries of SkyPier (the SkyPier Plan). Seven ferry movements were recorded with minor deviations from the diverted route during the reporting period. Notices of deviation were sent to the ferry operators and the cases have been investigated. Six cases in February 2018 and one case in March 2018 were due to public safety considerations or emergency situations, i.e., giving way to other vessels or avoiding collision with floating objects to ensure safety, and the HSFs had returned to the normal route following the SkyPier Plan as soon as practicable. The summary of the SkyPier Plan monitoring result is presented in Graph 3.
Insufficient AIS data were received from some HSFs during the reporting period. After investigation, it was found that AIS data for the concerned ferries were missing due to effects of interference of the signal as reported by the ferry operators after checking the condition of the AIS transponders. Vessel captains were requested to provide the radar track photos which indicated the vessels entered the SCZ through the gate access points and there was no speeding in the SCZ. Ferry operators’ explanation was accepted.
Graph 3: Summary of SkyPier High Speed Ferries Monitoring Results
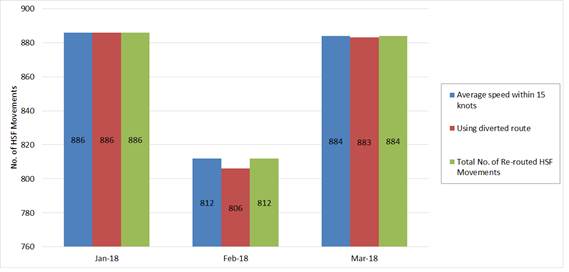
2.9
Audit of
Construction and Associated Vessels
On the implementation of MTRMP-CAV, the MSS automatically recorded deviation cases such as speeding, entering no entry zone, and not traveling through the designated gate. ET conducted bi-weekly audit of relevant information including AIS data, vessel tracks and other relevant records to ensure sufficient information were provided by the system and the contractors complied with the requirements of the MTRMP-CAV. The contactors submitted endorsed 3-month rolling vessel plan for construction vessel activities to AAHK in order to help maintain the number of construction vessels to a practicable minimum. The IEC also performed audit on the compliance of the requirements as part of the EM&A programme.
Between January and March 2018, deviations including speeding in the works area, entry from non-designated gates and entering no-entry zones were identified. All the concerned captains were reminded by the contractor’s MTCC representative to comply with the requirements of the MTRMP-CAV.
A total of 7 skipper training workshops were held by ET between January and March 2018 with 35 concerned captains of construction vessels associated with the 3RS Contracts to familiarise them with the predefined routes, general education on local cetaceans, guidelines for avoiding adverse water quality impact, the required environmental practices / measures while operating construction and associated vessels under the Project, and guidelines for operating vessels safely in the presence of CWDs. Another 17 skipper training workshops were held with 22 concerned captains by contractor’s Environmental Officers and competency tests were conducted subsequently with the trained captains by ET.
2.10 Coral
Post-Translocation Monitoring
In accordance with the approved Coral Translocation Plan (CTP), gorgonian corals suitable for translocation were translocated to the recipient site at Yam Tsai Wan (YTW), with translocation completed in January 2017. Since then the post-translocation monitoring programme has been undertaken according to the CTP. There was no scheduled monitoring survey during the reporting period from January to March 2018. The next monitoring survey will be carried out in April 2018 and the results will be presented in the next Quarterly EM&A Report.
2.11 Review of the Key Assumptions
Adopted in the EIA Report
With reference to Appendix E of the Manual, it is noted that the key assumptions adopted in approved EIA report for the construction phase are still valid and no major changes are involved. The environmental mitigation measures recommended in the approved EIA Report remain applicable and shall be implemented in undertaking construction works for the Project.
3
Report on Non-compliance,
Complaints, Notifications of Summons and Prosecutions
3.1
Compliance with Other Statutory Environmental Requirements
During the reporting period, environmental related licenses and permits required for the construction activities were checked. No non-compliance with environmental statutory requirements was recorded.
3.2
Analysis and Interpretation of Complaints, Notification of
Summons and Status of Prosecutions
3.2.1
Complaints
Two environmental complaints were received in the reporting period. All environmental complaints were attended to and investigation was conducted by the ET in accordance with the Manual and the Complaint Management Plan. The summary of the complaints and analysis is presented in Table 3.1.
Table 3.1: Summary of Environmental Complaints
|
Date of Complaint Received |
Details |
Analysis / Remedial Actions |
Status |
|
19 Jan 2018 |
A complaint was received regarding the use of non-road mobile machineries (NRMM) in works sites of HKIA under the Development Bureau’s Technical Circular (Works) No. 1/2015. |
While the mentioned Technical Circular applies only to the government's public works projects, and that the 3RS Project is not classified under public works, this Technical Circular does not apply to the case of the 3RS Project. Nevertheless, based on ET’s site inspections, it was observed that Contractors have used NRMMs with appropriate labels under Air Pollution Control (Non-road Mobile Machinery) (Emission) Regulation. |
Closed |
|
5 Feb 2018 |
A complaint was received on regarding noise from Sha Chau works. |
Based on information including daily inspection records and vessel records from 29 January 2018 to 4 February 2018, as well as the observation from the ad-hoc site inspection on 30 January 2018, no construction activities were conducted and no powered mechanical equipment was deployed at Sheung Sha Chau Island during the restricted hours. And there was no evidence on any non-compliance with the relevant EP conditions or the Construction Noise Permit (CNP) conditions found. Nevertheless, the contractor has been reminded to strictly follow the EP and CNP conditions and the ET will continue to conduct regular and ad-hoc inspections at Sheung Sha Chau to ensure relevant regulations and conditions are complied. |
Closed |
3.2.2
Notifications of
Summons or Status of Prosecution
Neither notification of summons nor prosecution was received during the reporting period.
3.3 Cumulative
Statistics
Cumulative statistics on valid exceedance, non-compliance, complaints, notifications of summons and status of prosecutions are summarized in Table 3.2 and Table 3.3.
Table 3.2: Statistics for Valid Exceedances for the Environmental Monitoring
|
|
|
Total No. Recorded in the Reporting Period |
Total No. Recorded since the Project Commenced |
|
1-hr TSP |
Action Level |
0 |
0 |
|
|
Limit Level |
0 |
0 |
|
Noise |
Action Level |
0 |
0 |
|
|
Limit Level |
0 |
0 |
|
Waste |
Action Level |
0 |
0 |
|
|
Limit Level |
0 |
0 |
|
Water |
Action Level |
0 |
0 |
|
|
Limit Level |
0 |
0 |
|
CWD |
Action Level |
0 |
0 |
|
|
Limit Level |
0 |
0 |
Remark: Non-project related triggers of Action or Limit Level are not shown in this table.
Table 3.3: Statistics for Non-compliance, Complaints, Notifications of Summons and Prosecution
|
Reporting Period |
Cumulative Statistics |
|||
|
|
Non-compliance |
Complaints |
Notifications of Summons |
Prosecutions |
|
This reporting period |
0 |
2 |
0 |
0 |
|
From 28 December 2015 to end of the reporting period |
0 |
10 |
1 |
0 |
4 Conclusion and Recommendation
In this quarterly period from 1 January 2018 to 31 March 2018, the EM&A programme has been implemented as planned, including 102 sets of air quality measurements, 65 sets of construction noise measurements, 39 sets of water quality measurements, 6 complete sets of vessel line transect surveys and 15 days of land-based theodolite tracking survey effort for CWD monitoring, 3 rounds of terrestrial ecology monitoring, as well as environmental site inspections and waste monitoring for the Project’s construction works.
The key activities of the Project carried out in the reporting period included reclamation works and land-side works. Reclamation works included DCM works, laying of sand blanket, seawall construction, and PVD installation. Land-side works included HDD works, site establishment, site office construction, road and drainage works, cable ducting, demolition and modification of existing facilities, concrete removal works, piling, and excavation works.
One monitoring result of 1-hour TSP triggered the Action Level in the reporting period, and the corresponding investigation was conducted accordingly. The investigation findings concluded that the case was not due to the Project.
Monitoring results of construction noise, construction waste, and CWD did not trigger any corresponding Action and Limit Levels in the reporting period. All site observations made by the ET were recorded in the site inspection checklists and passed to the contractor together with the recommended follow-up actions.
For water quality, the water quality monitoring results for DO, turbidity, and total alkalinity obtained during the reporting period complied with their corresponding Action and Limit Levels stipulated in the EM&A programme. Relevant investigation and follow-up actions will be conducted according to the EM&A programme if the corresponding Action and Limit Levels are triggered. For SS, chromium, and nickel, some of the testing results triggered the relevant Action or Limit Levels in the reporting period, and the corresponding investigations were conducted accordingly. The investigation findings concluded that the cases were not due to the Project; hence, no adverse impact was introduced to all water quality sensitive receivers.
In total, 2,582 ferry movements between HKIA SkyPier and Zhuhai / Macau were audited in the reporting period. All HSFs travelled through the SCZ with average speed within 15 knots, which complied with the SkyPier Plan. Seven ferry movements had minor deviations from the diverted route during the reporting period. ET investigated the deviation cases and confirmed that all of them were related to public safety or emergency situations.
Between January and March 2018, ET conducted bi-weekly audit of the MSS to ensure the system recorded all deviation cases accurately and the contractors fully complied with the requirements of the MTRMP-CAV. A total of seven skipper training workshops were held by ET between January and March 2018 for captains of construction vessels associated with 3RS contracts. Another seventeen skipper training workshops were held by contractors’ Environmental Officers and competency tests were conducted subsequently with the trained captains by ET.
On the implementation of MMWP, dolphin observers were deployed by the contractors for laying of open sea silt curtain and laying of silt curtains for sand blanket in accordance with the plan. On the implementation of DEZ Plan, dolphin observers were deployed for continuous monitoring of the DEZ by the contractors for ground improvement works (DCM works and PVD installation) and seawall construction in accordance with the DEZ Plan. Trainings for the proposed dolphin observers were provided by the ET prior to the aforementioned works, with the training records kept by the ET. From the contractors’ MMWP observation records and DEZ monitoring records, no dolphin or other marine mammals were observed within or around the silt curtains, whilst there were six records of dolphin sighting within the DEZ of DCM works in this reporting period. Audits of acoustic decoupling for construction vessels were also carried out by ET.
The recommended environmental mitigation measures, as included in the EM&A programme, have been effectively implemented during the reporting period. Also, the EM&A programme implemented by the ET has effectively monitored the construction activities and ensure the proper implementation of mitigation measures.
[1] The Manual is available on the Project’s dedicated website (accessible at: http://env.threerunwaysystem.com/en/index.html)